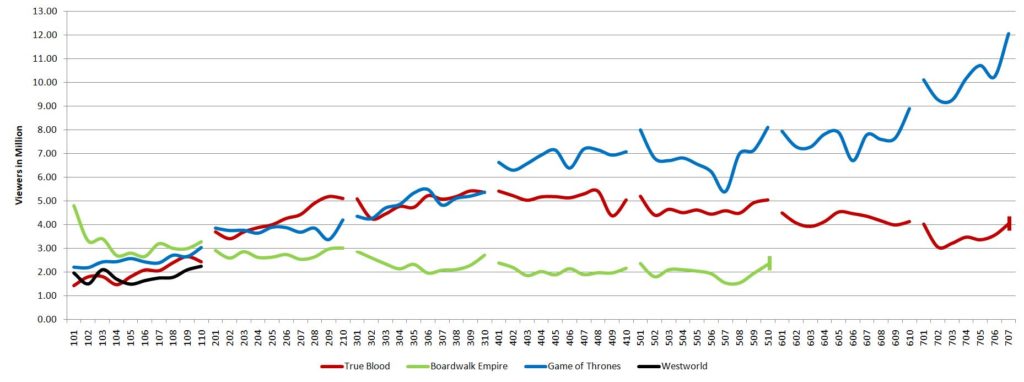
Here we are, Ladies and Sers, survivors of another Game of Thrones season. Phew. The Sunday finale saw the viewership record broken once more, and broken well. It is now time to visualize all the numbers of the season. First off, here is our trusty graph of viewers of the initial airing, updated with the back half of the episodes (click to enlarge):
The seventh season opened with a then-new record of 10.11 million viewers, which was about 27% more than previous year’s premiere, and 14% more than the finale. The numbers then climbed to reach the standing record of 12.07 million last Sunday. That’s an increase of 36% compared to previous year! The same-day viewership also grew staggeringly quick within the season, adding almost 20% more viewers between the premiere and the finale. For the first time in a while, all episodes of the seasons were seen by more people than any other previous episode.
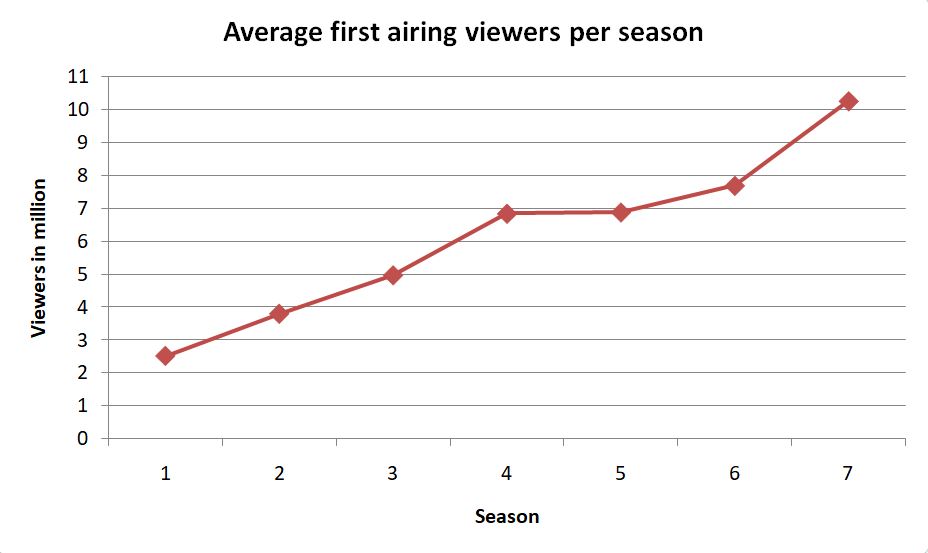
Season averages are also steadily increasing. This season’s episodes were seen by 10.26 million people on average, more than 2 million more than last year. I plotted all the seasons in the following graph.
The big cross-platform number that HBO is most interested in was 26 million last year. That many people saw the episodes of season 6 on average across all types of cable and digital subscriptions. We last reported this same number just for the premiere episode, and it stood close to 30 million. Vulture now reports that the big 3-0 mark has been exceeded by the season average, which stands at 30.6 million as we speak, and that’s a yet incomplete number not including the finale. The final tally, which we’ll be sure to report on, is going to be big indeed. Note that the estimated HBO subscriber base is about 50 million.
So, that’s it for the numbers. For a wee while, at least …


![[Book Review] The Blade Itself (The First Law Trilogy) by Joe Abercrombie](https://bendthekneegot.com/wp-content/uploads/2018/01/1516047103_maxresdefault-218x150.jpg)


